Pre-Election Polling
Pre-election polling can measure the public’s approval of incumbents and challengers; support for policies discussed in the campaigns; participation in the campaign process; enthusiasm for candidates, responses to debates, speeches, or unfolding events; sources of information about candidates and issues; perceptions of candidate’s personal characteristics; support for state ballot initiatives - as well as the most common item, vote intention.
So-called “horserace” polls measure candidate choice in elections before election day. Starting as early as the weeks following the previous election, national and state polling organizations regularly ask questions about which individuals Americans would like to see run in the next presidential election, which candidates they support in the primaries, and ultimately which presidential candidates they support in the general election. Polls increase in accuracy as the election approaches and as voters commit to their final decision.
While the candidate selections remain hypothetical in the days long before the actual election, polling organizations will generally sample the whole national adult population. But as the election nears, most polling organizations will begin to filter respondents to target those expected to vote. The simplest approach is asking respondents if they are registered to vote and then only interviewing self-reported registered voters.
Registered voters suffer from some limitations, however. A substantial number of registered voters do not actually vote in any particular election. Also, self-reported registration is higher than actual registration.
Many polling organizations therefore use some sort of likely voter screen, one or more questions intended to limit the sample to those most likely to vote. These questions range from simply asking the respondent if they intend to vote, to asking about prior voting, enthusiasm about the current election, and awareness of the location of their polling place. The choices made in creating a likely voter screen affect accuracy, and every choice carries some risks. A “tight” likely voter screen based on multiple criteria risks missing voters, particularly new voters or those who traditionally have not voted at high rates, but are motivated to vote in a particular election. A “loose” voter screen risks including too many people who will not ultimately turn up to vote. The complexity of modeling an electorate that changes with every election cycle makes predictive election polling extremely difficult compared to issue polling of the full adult population, particularly when elections are decided by very small margins, requiring a high degree of accuracy to make correct “calls” on results.
Sampling methodology in horserace polls is as varied as non-election polling, and includes probability-based RDD telephone samples, probability-based online panels, non-probability-based online polls, and mixed methods polls. Some polling organizations use voting list samples to limit their samples to likely voters; voting lists can vary in quality depending on how frequently they are updated, what additional checks are put in place by the organization providing the list, the mobility of the population, and other factors.
National horserace polling is conducted by many major polling organizations, including ABC, CBS, CNN, NBC, Monmouth, Marist, Quinnipiac, and others. Some state polls in key battleground states in the primaries and general election are conducted by national organizations. State organizations like the Minnesota Star Tribune, the Iowa Poll, or the Eagleton Poll in New Jersey, as well as some national organizations that conduct polls online or via IVR (Interactive Voice Response, or “robocalls”) conduct polls at the state level.
State-level polls commonly ask respondents about their vote intention in gubernatorial and Senate races. House races are based around Congressional districts, and therefore are rarely polled, an exception being the special NYT Upshot/Siena project described below. National polls, by comparison, often ask about Congressional elections through a “generic ballot” question that asks whether respondents plan to vote for the Democratic or Republican candidate in their Congressional district. Political scientists make use of this measure to understand broad trends in national party preferences, but the national results cannot be applied to any particular state or district race.
In addition to polls of the general public and registered or likely voters, Roper Center holds special population polls related to elections. Some organizations conduct polling around presidential and vice-presidential debates. For these polls, interviews are conducted before the debate, and respondents asked if they intend to watch the debate. Those who indicate they plan to watch are then contacted again after the debate. A few delegate polls from the 1980s and 1990s offer insight into the attitudes of convention-goers.
Polling questions on presidential elections can be found in iPoll under the topic “Vote for President” and other questions can be found under the topic “Elections.” For special population polls, use the Sample Type filter and select “Speech & Debate Watchers” or “Delegates” under “Political.”
NYT Upshot/Siena College Polls
Years: 2016-present
Sample size: 500-1500 (Larger samples after 2018)
The Upshot series consists of pre-election telephone polls at the state or district level based on probability selection from voter lists. Calls are made to a stratified weighted sample of voters from a commercially available voter list via both land and cell phones. Sample was stratified by age, region, gender, party, race, marital status, home ownership, state house district, and turnout in previous national election. A likely-to-vote probability was computed for each respondent based on their stated likelihood to vote as well as by virtue of the imputation of a turnout probability score based on past voting behavior.
Upshot poll reports include information on results under multiple weighting scenarios, non-response among subgroups, and evolving totals over the course of the interviewing period. Results were reported on the New York Times website as interviews were conducted, with an approximate 30-minute lag time.
Exit Polls
Exit Polls (NEP/VRS/VNS/CBS/ABC/LAT/NBC/Votecast)
The exit polling methodology was pioneered by Warren Mitofsky and Murray Edelman in the early 1970s. Questions are asked of actual voters by approaching people as they leave their voting place, and the results are used for election-night analysis in the media, as well as post-election analysis by academic researchers and others. Although some interviewing of exiting voters had been conducted back to the 1940s, modern exit polling began with the first systematic, probabilistic sampling of precincts and voters. CBS News supported the first national election day exit poll in 1972, and other media organizations soon followed suit. In 1990, the major networks joined forces to create a consortium to support a single exit poll, Voter Research and Surveys (VRS), which became Voter News Service (VNS) in 1994. In 2004, VNS was replaced by the National Election Pool media consortium, with exit polls conducted by Edison Research.
Exit polls are generally limited to voters; however, as voting increasingly occurs via mail/absentee ballot, exit polls have become more dependent on self-reported voting than in the past.
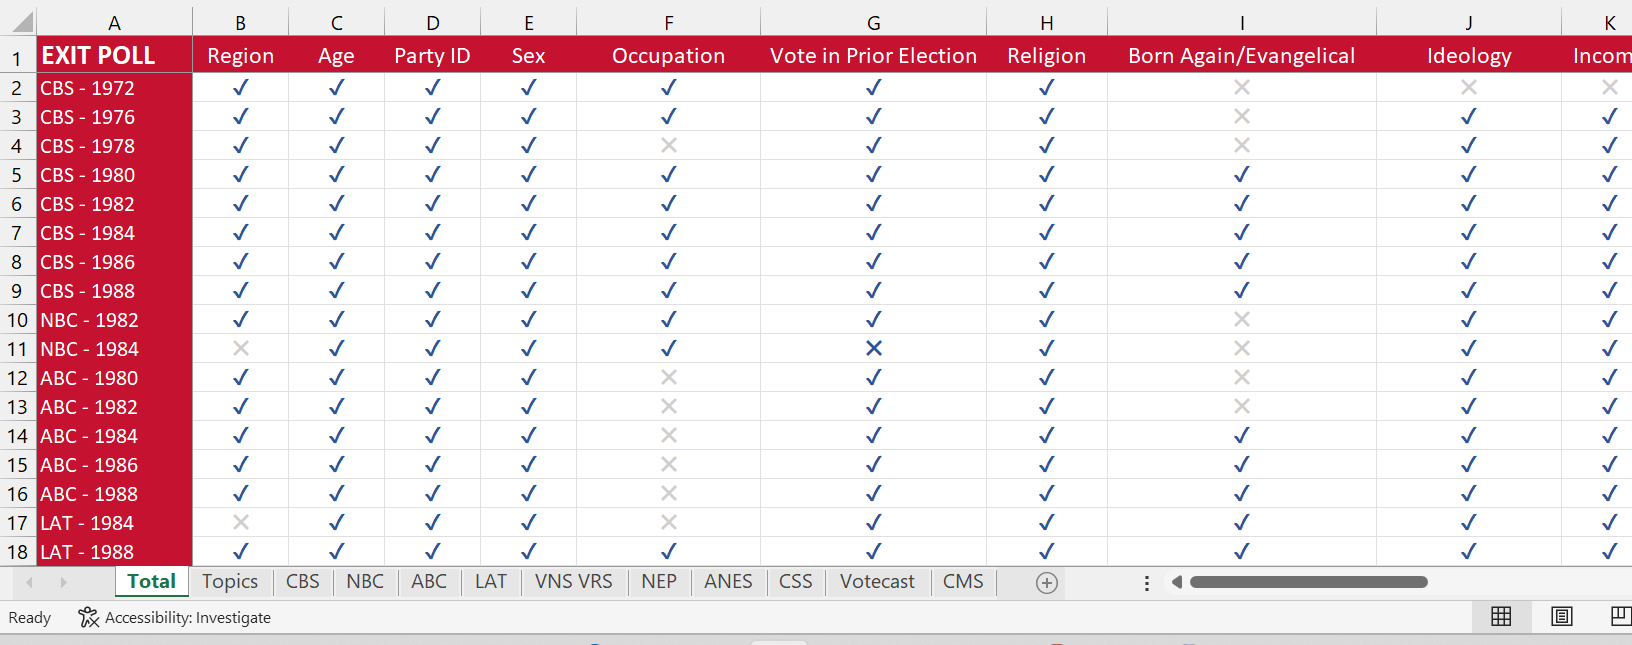
One of exit polling’s most important contributions to election studies is capturing demographic information about voters. The data team at the Roper Center has compiled a spreadsheet of the demographic variables available for every exit poll from every year available in Roper iPoll. Download it here.
More information: National exit polling topline results are searchable at the question level in Roper iPoll. State results for recent elections are also searchable at the question level.
A list of national election day exit polls is available on the Roper website. From 1978 onwards, individual state polls have been conducted in conjunction with the national poll on election day, as well as during the primaries. For information on which states were polled in specific years, see State Election Day Exit Polls and State Primary Exit Polls.
For more information on methodologies of exit polls, see individual study documentation, as well as the following articles:
Levy, M. R. (1983). The Methodology and Performance of Election Day Polls. Public Opinion Quarterly, 47(1), 54. https://doi-org.proxy.library.cornell.edu/10.1086/268766
NEP/VRS/VNS Exit Polls
Years: 1972-present
Sample sizes: Approximately 20,000 in the national polls, state polls vary from about 500-2,500.
Description/Methodology: The media consortium exit polls are conducted with a probability-based sample of each state’s election precincts, stratified by size of vote in the last election, with a probability selection of every Xth exiting voter from the voting location, with the number being based on the size or demographics of the voting population in the precinct. Ballots are self-administered. Starting with the 2000 election, the exiting voter poll has been supplemented with an RDD telephone survey to capture mail-in voters.
Of highest value to the researcher are the final weighted data that are calculated once the final election results are certified. The raw exit poll data are weighted to the actual vote, with some additional modifications to address systemic nonresponse based on interviewer reports of refusals. The data therefore can be used to estimate the voting population among demographic groups.
Votecast
Years: 2018-present
Sample sizes: Approximately 140,000. Includes non-voters.
Description/Methodology: AP Votecast, which debuted in 2018, is sponsored by the Associated Press and Fox News and fielded by NORC at the University of Chicago. Votecast is a mixed-mode survey, with both probability-based and non-probability-based samples. Interviews with a random sample of registered voters drawn from state voter files are combined with self-identified registered voters conducted using NORC's probability-based AmeriSpeak® panel, which is designed to be representative of the U.S. population. An additional sample surveys self-identified registered voters selected from a nonprobability online panel. The questionnaire has multiple forms to limit the length of the survey, so not all respondents answer all questions. The multiple approaches for selecting and contacting the sample are intended to ensure that all voters can be reached and to create a cost-efficient sample of a large size that allow analysis of small subpopulations. The inclusion of non-voters allows comparisons between voters and non-voters.
State-level surveys are also conducted, with varying methodologies from the largest samples of 1,000 probability-based interviews conducted online and via phone and roughly 3,000 nonprobability interviews, to the smallest 1000-person non-probability online samples only.
The surveys are weighted in multiple ways, using Census data to weight on standard demographics, a calibration weight to match the non-probability sample to the probability-based sample on additional measures predictive of vote choice, a substate geographical weight, and finally a weight to the final actual vote counts.
More information: AP Votecast is part of Roper Center’s Recently Developed Methods Collection, question search is available. https://www.norc.org/Research/Projects/Pages/ap-votecast.aspx
Los Angeles Times
Years: 1984-2002
Sample sizes: Approximately 6,000-12,000
Description/Methodology: In-person, self-administered surveys of exiting voters were conducted based on sampling of precincts based on precincts based on the pattern of turnout in past general elections and a random selection of individual voters. Results were weighted to age, gender and ethnic origin based on interviewer reports of those voters who refused to participate, and the final results were weighted geographically to the final vote. National and California samples were surveyed.
In 2000, the California sample was supplemented with an RDD telephone survey to capture absentee voters.
NBC News
Years: 1982-1984
Sample sizes: Approximately 6,000-12,000
Description/Methodology: In-person, self-administered surveys of exiting voters were conducted based on sampling of precincts based on precincts based on the pattern of turnout in past general elections and a random selection of individual voters using the every Xth voter method. Interviewers recorded perceived demographic characteristics of non-responders. Results were weighted.
ABC News
Years: 1980-1988 (presidential and congressional elections)
Sample sizes: 9,700 (1980) -95,000 (1988) (years between these surveyed roughly 20,000)
Description/Methodology: In-person, self-administered surveys of exiting voters were conducted based on sampling of precincts based on precincts based on the pattern of turnout in past general elections and a random selection of individual voters using the every Xth voter method, with some modification to the skip interval made to reflect turnout. ABC News exit polls were unweighted.
Pre-and-Post Election Polls
Some special election projects interview respondents twice, once before and once after the election. This approach can provide insights about how voters make decisions and how attitudes change over the course of the election process.
ANES (American National Election Study)
Years: 1948-present. 1948, 1952 presidential elections, 1956-2002 presidential and midterm elections, 2004-present presidential elections. In addition, pilot surveys are conducted in some non-election year to test new methods and questions.
Sample sizes: Approximately 1500-8000 respondents per wave, except for the first 1948 election (662)
Description/Methodology: The ANES (American National Election Study) is the longest-running major election survey project in the United States. Surveys have been based on probability sampling from the first. Surveys are conducted in two waves, before and after elections, with the same respondents contacted in both waves. The surveys were conducted entirely in-person, using area probability sampling, until 1998. In 2000, the first mixed mode ANES survey was conducted, with samples contacted both in person and by telephone. 2002 was conducted entirely by RDD telephone sampling. Surveys from 2004 to 2012 were conducted in person, in 2016 the survey was mixed mode, with in-person and web samples. In 2020 the survey was conducted by telephone, online, and by video interview.
In addition, ANES has included experimental and pilot studies with varying sample sizes and methodologies.
https://electionstudies.org/about-us/history/
CES (Cooperative Election Study, formerly CCES)
Years: 2006-2022 (yearly)
Sample size: Common Content 50,000
CES (Cooperative Election Study, formerly Cooperative Congressional Election Study) consists of pre- and post-election online surveys, with the same respondents recontacted. The survey consists of a central set of questions known as the Common Content, which is fielded on the full survey sample of approximately 50,000 respondents. In addition, Team or Group Content is designed by individual researchers or one or more teams and fielded with a subset of 1000 or more respondents. Samples are created using YouGov panels. The sample is designed to be representative of the national adult population, and each weighted state sample to be representative of each state. To identify voters and non-voters, self-reported vote is validated against a commercial voter list file that has been cleaned and enhanced with information from multiple commercial databases.
Surveys are fielded every year. In election years, two waves are conducted, before and after the election. The pre-election wave is conducted late September to late October, the post-election in November. In non-election years, only one survey is fielded in the fall.
CES conducted a panel survey in 2010, 2012, and 2014.
CMS (Collaborative Midterm Survey)
Years: 2022
Sample size: Approximately 20,000
CMS (Collaborative Midterm Survey), consists of pre- and post-election surveys administered by multiple survey organizations using a variety of methodological approaches (probability and non-probability methods, national adult and registered voter samples, online and phone interviews). Three survey organizations were selected to collect CMS data following an international call for proposals that emphasized methodological innovation. Proposals to collect CMS data were reviewed anonymously. The survey consists of a central set of questions that were fielded by each survey organization. In addition, each survey organization asked an additional set of organization-specific questions, allowing the overall CMS project to maximize the number of questions included in the survey. All methodological variations are documented to allow researchers to analyze which methods, or combinations of methods, are best suited to answering specific research questions.